The Canadian dollar had an excellent week, despite weak Canadian employment data. USD/CAD secured the break under parity and broke under downtrend support. Inflation data is the major event this week. Here is an outlook on the major market-movers and an updated technical analysis for USD/CAD.
Canada lost over 30K jobs in July, and the unemployment rate rose to 7.3%. This seems like a correction after many good months. Purchasing activity edged up among Canadian companies in July rising to 62.8 from 49.0, well above predictions of 52.5, reaching its highest level in four months. However this is only one piece of good news since other data including the mild disappointing GDP growth suggest that recovery is mild at best and The European debt crisis still poses risks to the Canadian economy. Will things continue to improve?
- Foreign Securities Purchases:Thursday, 12:30. Foreign investors bought a record $26.109 billion of Canadian securities in May while Canadians purchased $1.317 billion foreign securities in the same month. This record high reading beat predictions of $13.51 billion and followed 10.16 billion in April. Non-resident investors purchased $16.7 billion of Canadian bonds and $7.3 billion of Canadian money market instruments in May. These elevated figures topped US data in May. A drop to $10.67 billion is expected now.
- Manufacturing Sales: Thursday, 12:30. Manufacturing sales dropped unexpectedly in May declining 0.4% following a sharper slide of 1.1% in April. Economists expected an increase of 0.7%. The major drop was in petroleum and coal 9.6% amid temporary shutdowns at some refineries while transportation equipment gained 8.1%. These mixed results contributed to the poor GDP growth on May. A 0.4% gain is forecasted this time.
- BOC Review: Thursday, 14:30. The spring edition of the BOC Review pointed on the satisfactory conduct of the Canadian economy regarding inflation targeting but warned against deficit and constricted trading practices. The BOC also examined the international economic scene indicating that the G20 reforms must be carried out to avoid international calamity.
- Inflation data: Friday, 12:30. Price pressures are subdued in Canada for the time being with an unexpected drop of 0.4% both in headline CPI and Core prices in May, following 0.1% decline in CPI and a 0.2% gain in Core CPI during April. However on a yearly base Core and headline reading showed CPI increased by 1.5% in June and Core gained 2.0% although both readings were below forecasts. A 0.3% increase is expected both in headline CPI and Core CPI.
* All times are GMT.
USD/CAD Technical Analysis
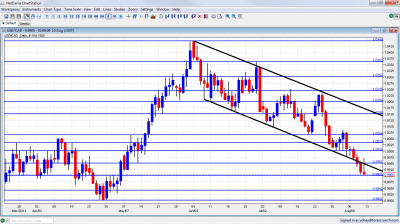
$/C$ was struggling with parity early in the week. After the pair secured lower ground, it continued falling, and a last minute surge was only temporary: the pair eventually closed at 0.9905., just above the 0.99 line mentioned last week.
Technical lines, from top to bottom:
We start from lower ground this time. 1.0360 was a pivotal line in June 2012 and is now significant resistance. It proved its strength in June 2012. The round number of 1.03 was resistance at the beginning of the year and now returns to this role. It worked perfectly well during June – over and over again, until finally being run through.
1.0245 served as a separator for the move up when the pair rallied in May 2010 and regains some strength now, thanks to capping the pair in July 2012, twice during this month The round figure of 1.02 was a cushion when the pair dropped in November, and also the 2009 trough. It remains a distinct separator after working as such in July.
1.0150 was a swing low in September and worked as resistance several times afterwards. It was challenged in June 2012. and served as a separator in July 2012.
1.0066 was key support before parity. It’s strength during July 2012 was clearly seen and it gave a fight before surrendering. Now, it is somewhat weaker. 1.0030 is another line of defense before parity after capping the pair earlier in the year. The move below this line is not confirmed yet.
The very round number of USD/CAD parity is a clear line of course, and the battle was very clear to see at the beginning of August 2012. Under parity, we meet another pivotal line at 0.9950. It served as a top border to range trading in March 2012 and later as a line in the middle of the range. It is now weaker.
0.99, the round number is now present on the graph after capping the pair in May 2012 and providing support in August. 0.9840 provided support for the pair during September and was reduced to a minor line now.
Lower, 0.9725 worked as strong support back at the fall of 2011. The last line for now is 0.9667, which was another strong cushion in the past.
Downtrend Channel Broken
As you can see on the graph, the pair broke below downtrend support – the line worked from mid May and worked perfectly well until the decisive break.
I remain bearish on USD/CAD.
Despite the worries from the jobs report, an improving US, the relative calm in Europe and relativelyhigh oil prices and a hawkish central bank help the Canadian dollar.

No comments:
Post a Comment